
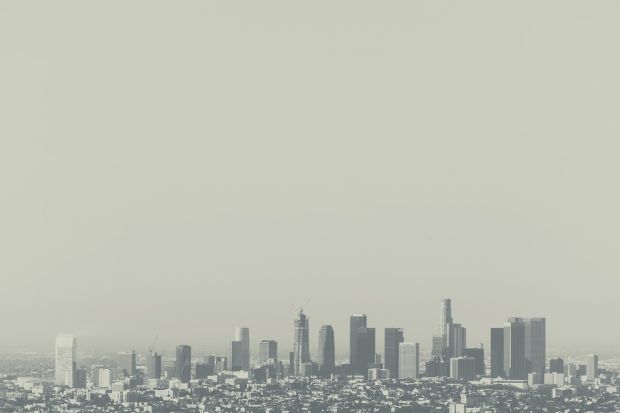
The American Lung Association has recently published its 2017 State of the Air report - and, once again, California has the dubious honor of ranking first for air pollution. The report ranks U.S. counties and cities by recorded levels of ozone and particle pollution, and for yet another year, the Los Angeles basin came out as the most polluted in the country.
Bakersfield, Visalia-Porterville-Hanford, and Fresno-Madera, all of them in California, are the top three cities with the worst short-term pollution, whereas Visalia leads in year-round pollution and Los Angeles shows the worst ozone pollution. In fact, in almost 100% of the ranking types, California towns take the most spots.
The data collected between 2013-2015 shows clear indications that demographic expansion is a partial culprit (the population in the area more than doubled in 50 years), and industrialization is another enhancing factor. Despite strict environmental policies and an overall reduction in pollution levels, industrialization, and the infamous Los Angeles traffic is to be blamed for both ozone (made more dangerous by the California sun) and particulate matter pollution. Consequently, the American Lung Association suggests driving is the first thing Californians should cut down on. Other factors are harder to control: hot weather and wildfires also contributed to sending the Golden State at the top of the worst polluters for 17 out of 18 years of this report's existence.
On the other end of the spectrum are the cleanest cities by all ranking methods: Burlington-South Burlington, VT; Cape Coral-Fort Myers-Naples, FL; Elmira-Corning, NY; Honolulu, HI. There is good news to be found here: the cleanest air is not necessarily in rural areas, as cities have lately intensified their efforts to curb pollution.
The data was collected (through a contracted party) from the U.S. Environmental Protection Agency's Air Quality System, for a three-year period - which is standard in most pollution research so that anomalies do not tilt the accuracy of the measurements.
The grades for ozone and short-term particle pollution (24-hour PM2.5) were based on a weighted average for each county. Particle pollution is analyzed based on a yearly average and a 24-hour period.
While the methodology for data collection and analysis is largely based on the EPA's own (such as using the EPA ozone standard of 70 parts per billion measured over 8 hours), the system used by the American Lung Association for this study is much stricter than the EPA's. For instance, the EPA assesses violation of the ozone standard based on the fourth maximum daily 8-hour ozone reading each year averaged over three years, whereas the ALA also takes into account multiple days of unhealthy air. Thus, the researchers warn, certain counties "will receive grades of 'F' in this report, showing repeated instances of unhealthy air, while still meeting the EPA's 2015 ozone standard."